
Animal Crossing Creature Catalog
For this project, I created a searchable, filterable, interactive interface cataloguing all of the creatures a player can catch in the video game Animal Crossing: New Horizons to help players keep track of their collection progress.
A bit of background…
Since its initial release in 2001 for the Nintendo 64 video gaming console, the Animal Crossing franchise has charmed and captivated players around the world with its endearing anthropomorphic animal characters, idyllic graphics, and meditative, often-escapist gameplay.
Now in its latest iteration on the Nintendo Switch console, Animal Crossing: New Horizons (ACNH) brings more features than ever. The game is packed with a seemingly endless list of activities to complete, structures to build, and items to collect as the player builds an entire village from the ground up on an initially deserted island.
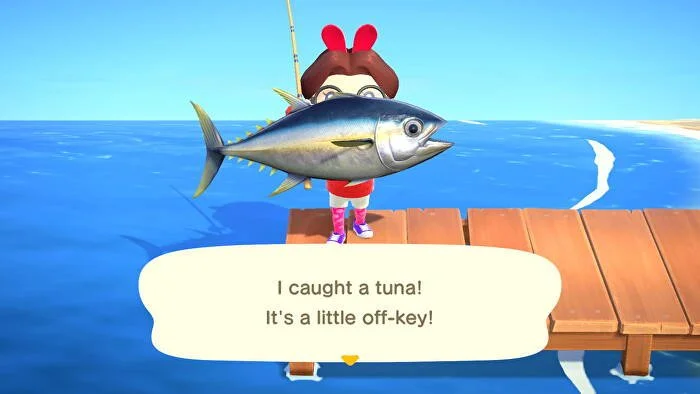
Above: a screenshot from the game when the player catches a tuna. Honestly, the catch phrases are my favorite part of the game.
As an ACNH player myself, I couldn’t help but notice the abundance of data - and all of the associated metadata - that goes into building such an elaborate virtual world. Inspired by a class assignment on information organization and retrieval, I wanted to build an interactive interface to arrange the vast collection of bugs, fish, and sea creatures that a player can collect into a sensibly organized, searchable, explorable visual creature catalogue.
The Process
Step 1: Acquiring the data
To-date, there are 80 bugs, 80 fish, and 40 sea creatures available for collection in the game, making a total of 200 resources to organize based on their metadata such as seasonal availability, time of day spotted, location, size, color, and so on.
Much of this data and metadata had fortunately already been crowdsourced (via contribution to a Google spreadsheet) and published as various open source datasets, such as this one and this one, both of which are publicly available .csv files of in-game assets that are periodically updated on Kaggle. I downloaded the relevant data sets for fish, insects, and sea creatures to my local drive and loaded the .csv files into R to inspect and organize these datasets.
Step 2: Organizing the data
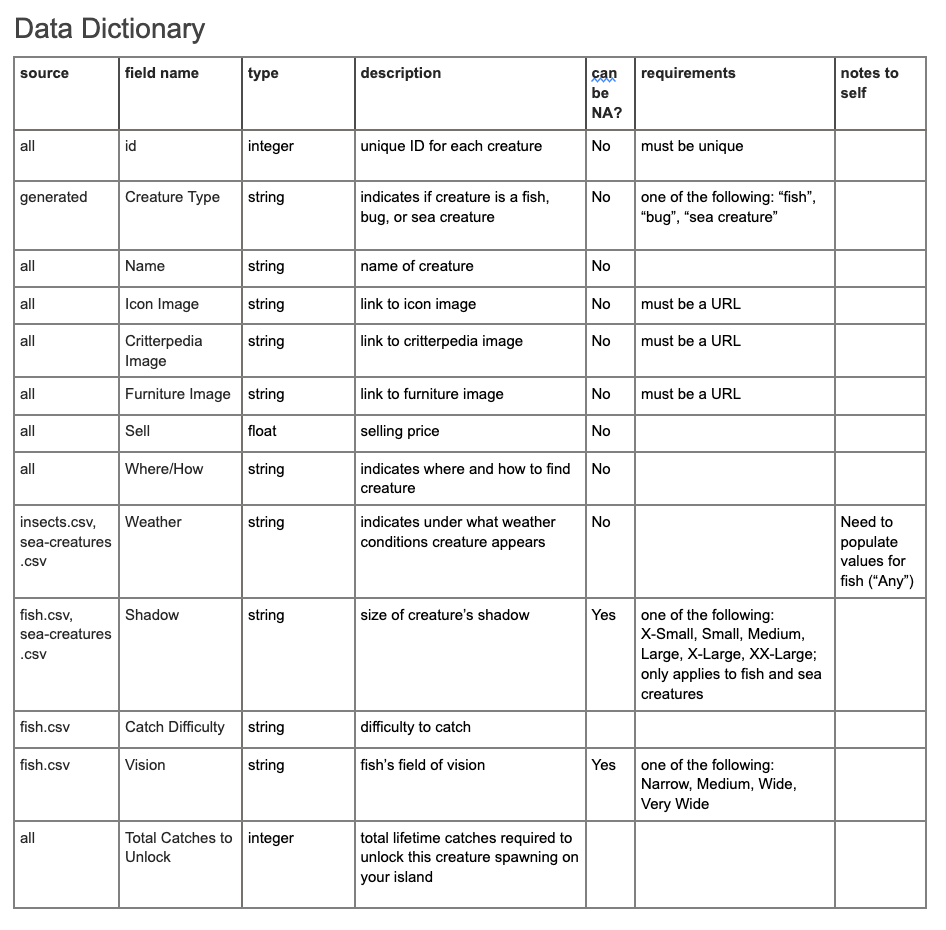
After acquiring the data sets I needed, I created a data dictionary to keep track of all of the columns I intended to keep (or drop) in my new data set, as well as the new columns I wanted to add. The first few rows of this dictionary are displayed below:
I also ensured that every data set was structured with the same columns for holding information, such that combining them all into a single data set would actually be possible.
I then wrote an R script to carry out the process of cleaning, standardizing, and merging the relevant columns of all data sets and added several of my own metadata elements, to create my new master dataset which would then be loaded into Tableau for the next step of building the user interface.
Step 3: Building and publishing the interface!
I built the user interface using my preferred data visualization software, Tableau. I knew I wanted users to be able to look up creatures based on different combinations of their metadata attributes, so I incorporated several flat facets into a filters bar on the left-hand side of the interface to allow the user to search the catalog of creatures by the following attributes:
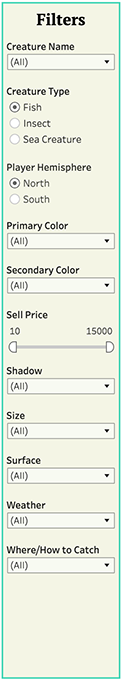
Above: the final filters bar.
Creature Name (direct search)
Creature Type
Player Hemisphere
Primary Color
Secondary Color
Sell Price
Shadow
Size
Surface
Weather
Where/How to Catch
In the process of creating these filters, I discovered that Tableau doesn’t natively display hierarchical filters, so I made the decision to flatten the “Where/How to Catch” filter into a single flat facet.
In a future iteration, I may consider trying to build out a hierarchical facet in which, for example, the result “River” would further drill down into “Clifftop” or “Mouth”, rather than displaying all options on a single level as “River (clifftop)” and “River (mouth)”.
However, after conducting a few usability tests for the catalog, I concluded that the data set was small enough that this additional level was not necessary for successful navigation and understanding of this catalog.
Additional Tableau-level Calculated Fields

I had to pivot the columns in my data set indicating catch times by hemisphere and month and create several additional calculated fields in Tableau in order to properly display the data for Player Hemisphere and the catch time frames by months in the interface. These fields are shown to the right, for those interested:
Displaying Creature Images
I pulled all of the creature image files from their associated image URLs in the data set, then collected them into a single folder, and loaded them into the Shapes folder of my Tableau repository. I then associated each shape file with their respective Creature Name to be used for the interface. (All images are copyright Nintendo.)
In the interface, users are able to click on the creature images in the search results table in order to further pull up information about catching the creature of interest.
Uploading/Hosting the Interface
The interface was uploaded to and is now hosted online via Tableau Public and can be visited from any internet browser. I’m always open to feedback. Enjoy!
